Monitoring system comparison: Shinken vs Sensu vs Icinga 2 vs Zabbix
Disclaimer
That’s a long post with many images and even more text. There is no answer for simple questions like “which is best”, but a collection of information for decisions on these questions, based on your requirements. I’m looking for a system that works on Linux and monitors Linux well, so platform support is not considered. Also, I’m looking for a system that will help me monitor thousands of servers with tens of thousands of services.
In my own opinion, only Zabbix and Icinga 2 are mature enough to be used in the enterprise. The main question one should ask himself is which monitoring philosophy he could relate to because they do the same thing with very different approaches.
Shinken
In their own words, Shinken is a monitoring framework, a Python Nagios Core total rewrite, enhancing flexibility and large environment management.
Scalability
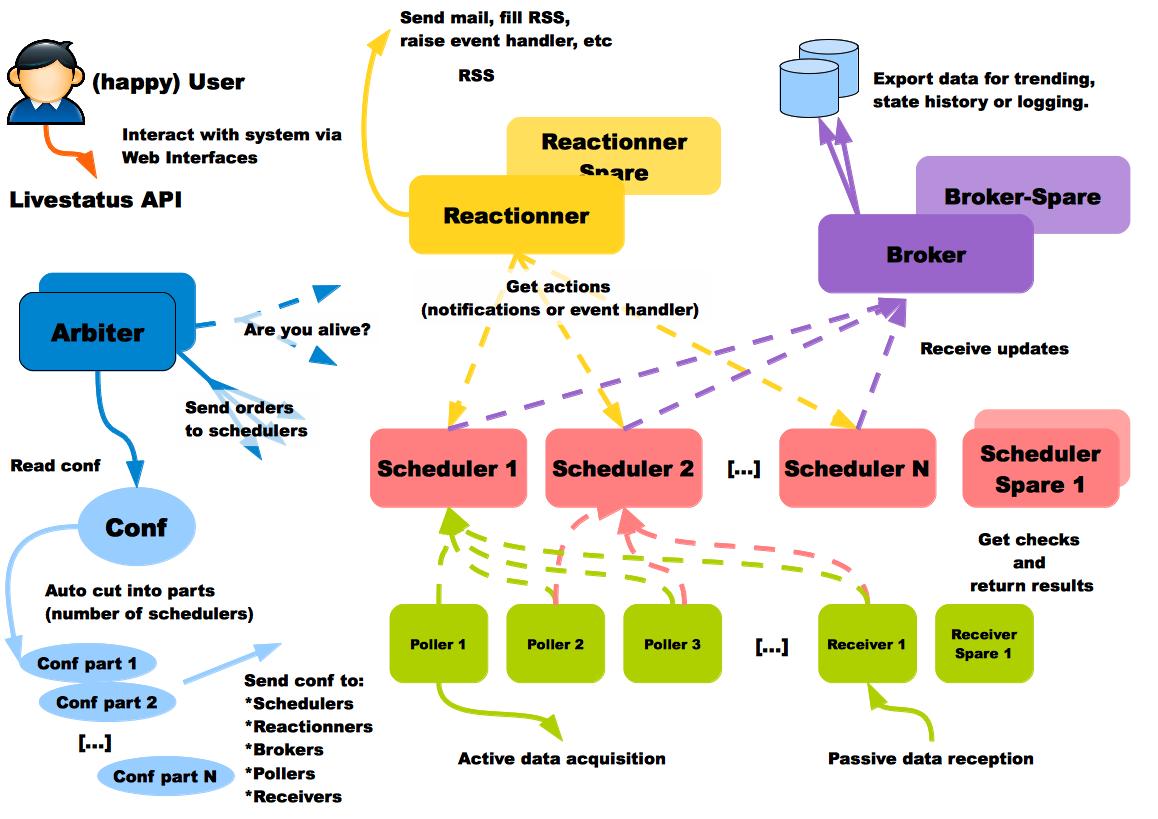
According to the documentation, every type of process can be run even on different hosts. That’s interesting because you might want DB in the cheapest place, data receivers in every data center, and alerter processes closer to your physical location. The Shinken user on the scheme is happy; that’s a positive sign:
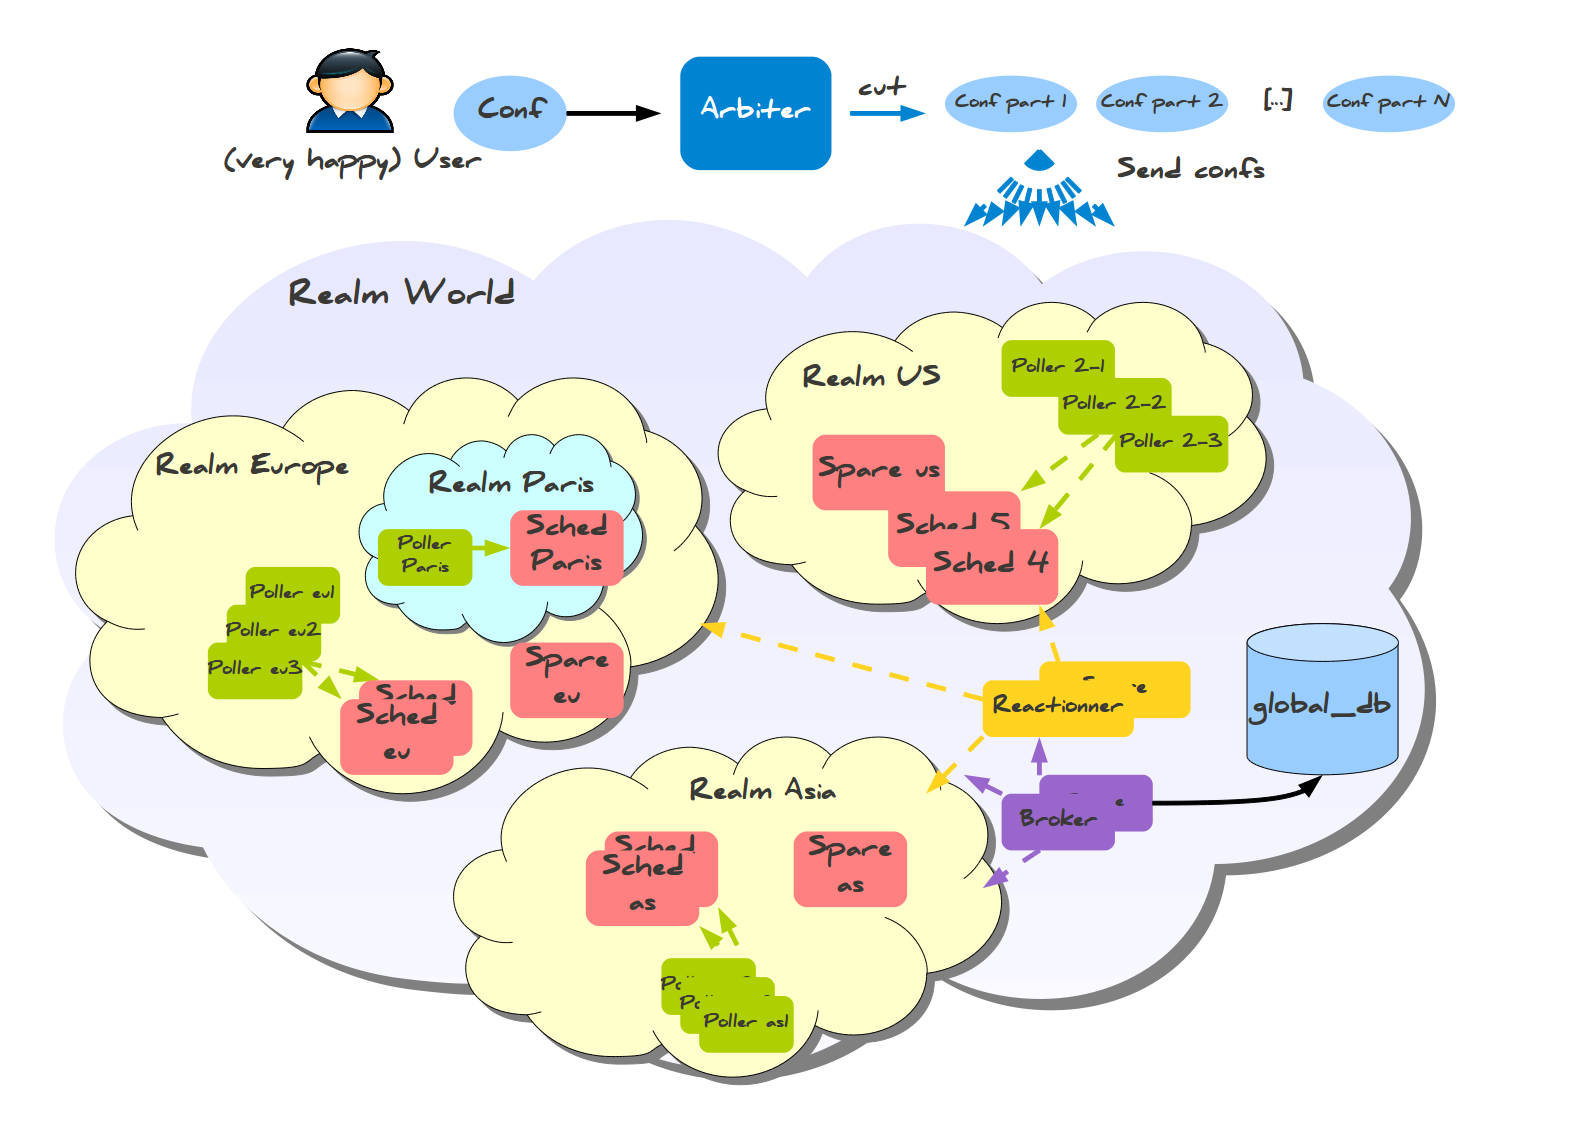
For multi-regional monitoring, there is also an answer, Realms.
Here, you notice something extraordinary: Data is collected into a regional DB, not into a global one. There is also sub-realms setup for smaller big setups, which requires fewer machines to set up and just one DB:
Another point to consider when you’re talking about scalability is fault tolerance. I’ll quote documentation here:
Nobody is perfect. A server can crash, an application too. That is why administrators have spares: they can take configurations of failing elements and reassign them. For the moment, the only daemon that does not have a spare is the Arbiter, but this will be added in the future. The Arbiter regularly checks if everyone is available. If a scheduler or another satellite is dead, it sends its conf to a spare node, defined by the administrator. This change informs all satellites to get their jobs from the new element and not try to reach the dead one. If a node was lost due to a network interruption and comes back up, the Arbiter will notice and ask the old system to drop its configuration.
Configuration systems integration
Automatic hosts and services discovery seems well-covered, and because the configuration is kept in files, you could quickly generate them yourself with Chef\Puppet, based on information on hosts you have.
Audit log
Because the configuration is stored in files, you could use generic things, like version control system (Git, Mercurial), to track changes and ownership. From the documentation, I found no evidence of Shinken tracking web-interface actions.
UI
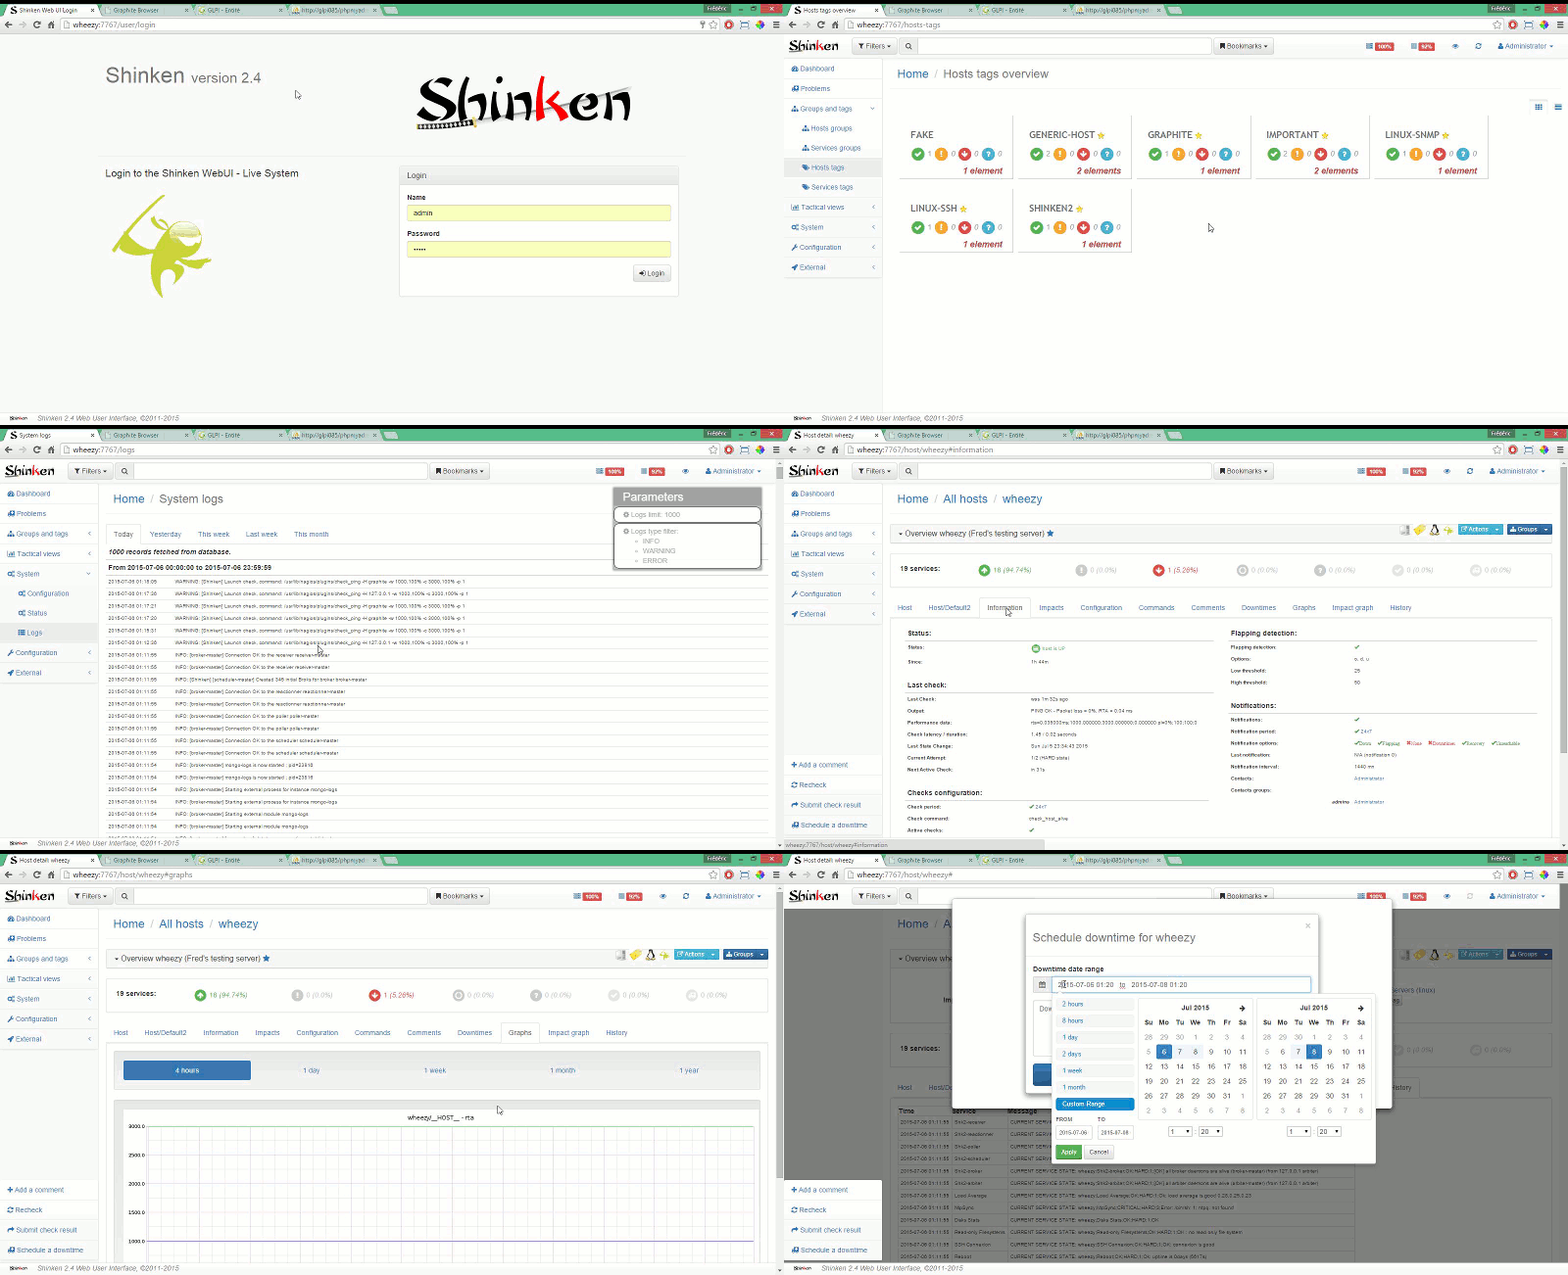
Shinken WebUI is proven to work well with thousands of hosts and tens of groups.
Drawbacks
I found no visible drawbacks based on the documentation. The only thing that concerns me is its rapid development in the past and very slow pace of commits in the present: around 40 commits this year; most are pull requests merged, so no new development is going on, and only community-written bugfixes are being included. It’s either too good to move on (which is never the case; even old-timers like vim and emacs get their code updated), or it’s another opensource project that not enough people care about — you should know such things before using such a complex thing as a monitoring system.
Frédéric Mohier was very kind to give me insight into the current situation: more than one year ago, some leading developers of Shinken left the project and made a fork named Alignak, which is being actively developed and plan to deliver 1.0 release in December 2016.
Update from 2021: Alignak never made it past 1.1.0 back in 2018.
Links
Sensu
Sensu is a monitoring framework (platform, as they call themselves) rather than a complete monitoring system. Its key features include:
- Puppet \ Chef integration — define what to check and where to send messages in your configuration system
- Reusing existing technical solutions where possible, instead of inventing their own (Redis, RabbitMQ)
Sensu pulls events from the queue and executes handlers on them; that’s it. Handlers can send messages, run something on the server, or do something else you want.
Scalability
Sensu’s architecture is flexible because every component can be replicated and replaced in a few ways. The following presentation describes a sample fault-tolerant setup is described; here is a generalized view:
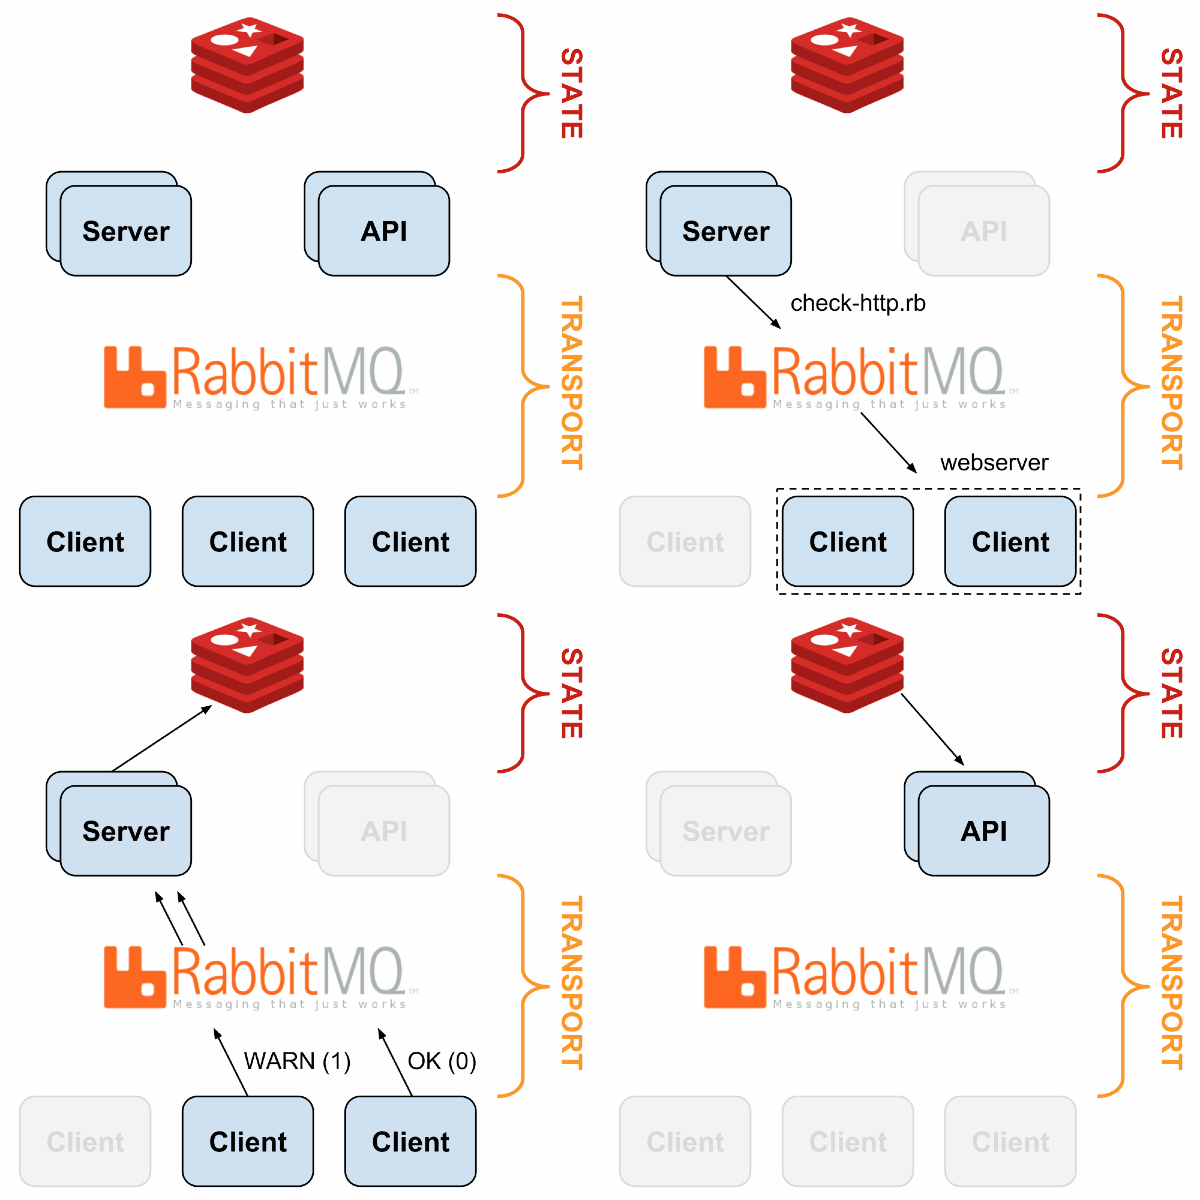
With HAProxy and Redis-sentinel, you can build a setup in which, if one node of a type is alive (Sensu API, Sensu Dashboard, RabbitMQ, Redis), your monitoring will continue to work without manual intervention.
Configuration systems integration
Built-in (Puppet, Chef, EC2!) but only in paid version, which sucks for sure if you have thousands of servers and don’t want to pay for something with free analogues.
Audit log
Built-in, however, only in Enterprise edition.
UI
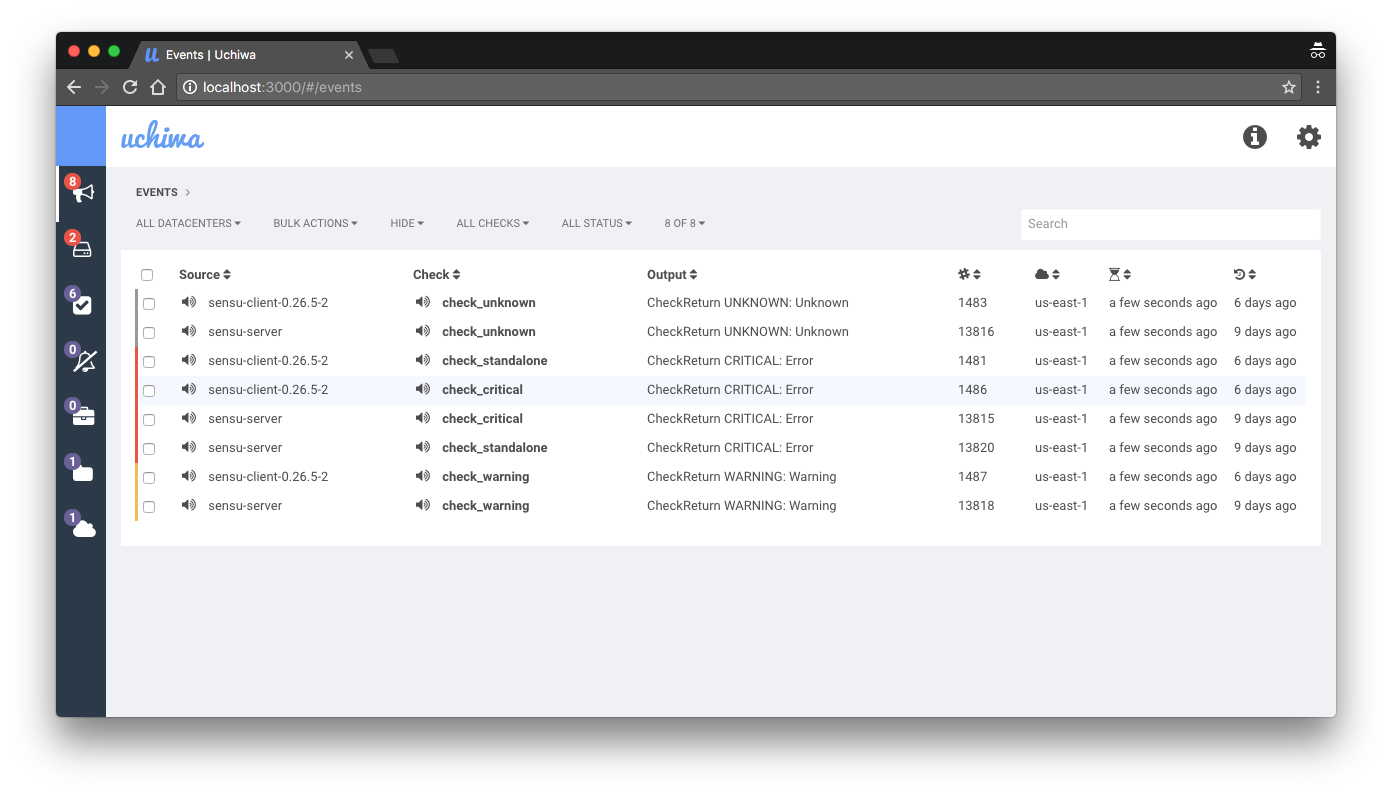
Sensu default UI called Uchiwa seems to have many limitations. It seems too simple for a diversified environment with thousands of servers. The enterprise edition comes with its dashboard; however, it doesn’t seem to be doing much, except adding a few disabled out-of-the-box features over the opensource part (like audit).
Drawbacks
- Lack of historical data and minimal ability to check on it;
- Create your monitoring system; there are no working presets waiting for you;
- Aggregation of events is tricky;
Message sending is very tricky, which is scary (because this part must be the most straightforward and most reliable part of monitoring)— not true, I had the wrong impression by documentation, thanks x70b1 for an explanation;- The “We don’t want to reinvent the wheel” way has its limitations of which you could be aware of if you had used any such software before (in my case, it was Prometheus monitoring system, which left whole sets of features up to the user to implement, like authentication).
Links
Icinga 2
Icinga is the fork of Nagios, rewritten from scratch in version 2. Opposite to Shinken, it is a good fork with constant updates being made.
Scalability
General architecture:
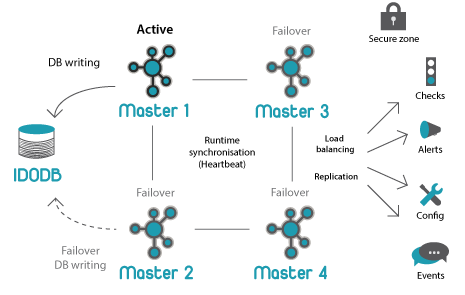
Icinga 2 has a well-designed distributed monitoring scheme. The only pitfall I found while setting up the test cluster is the number of settings related to distribution: It could be overwhelming initially.
Configuration systems integration
Pretty good; here are two presentations: The Road to Lazy Monitoring with Icinga 2 and Puppet by Tom de Vylder and Icinga 2 and Puppet: Automated Monitoring by Walter Heck. The key Icinga feature is storing configuration in files, making them easy to generate on the Puppet side, which I achieved using PuppetDB as a data source about all hosts and services.
Audit log
As I found, the audit log is present with the director module. There is no built-in audit in IcingaWeb2 at the moment.
UI
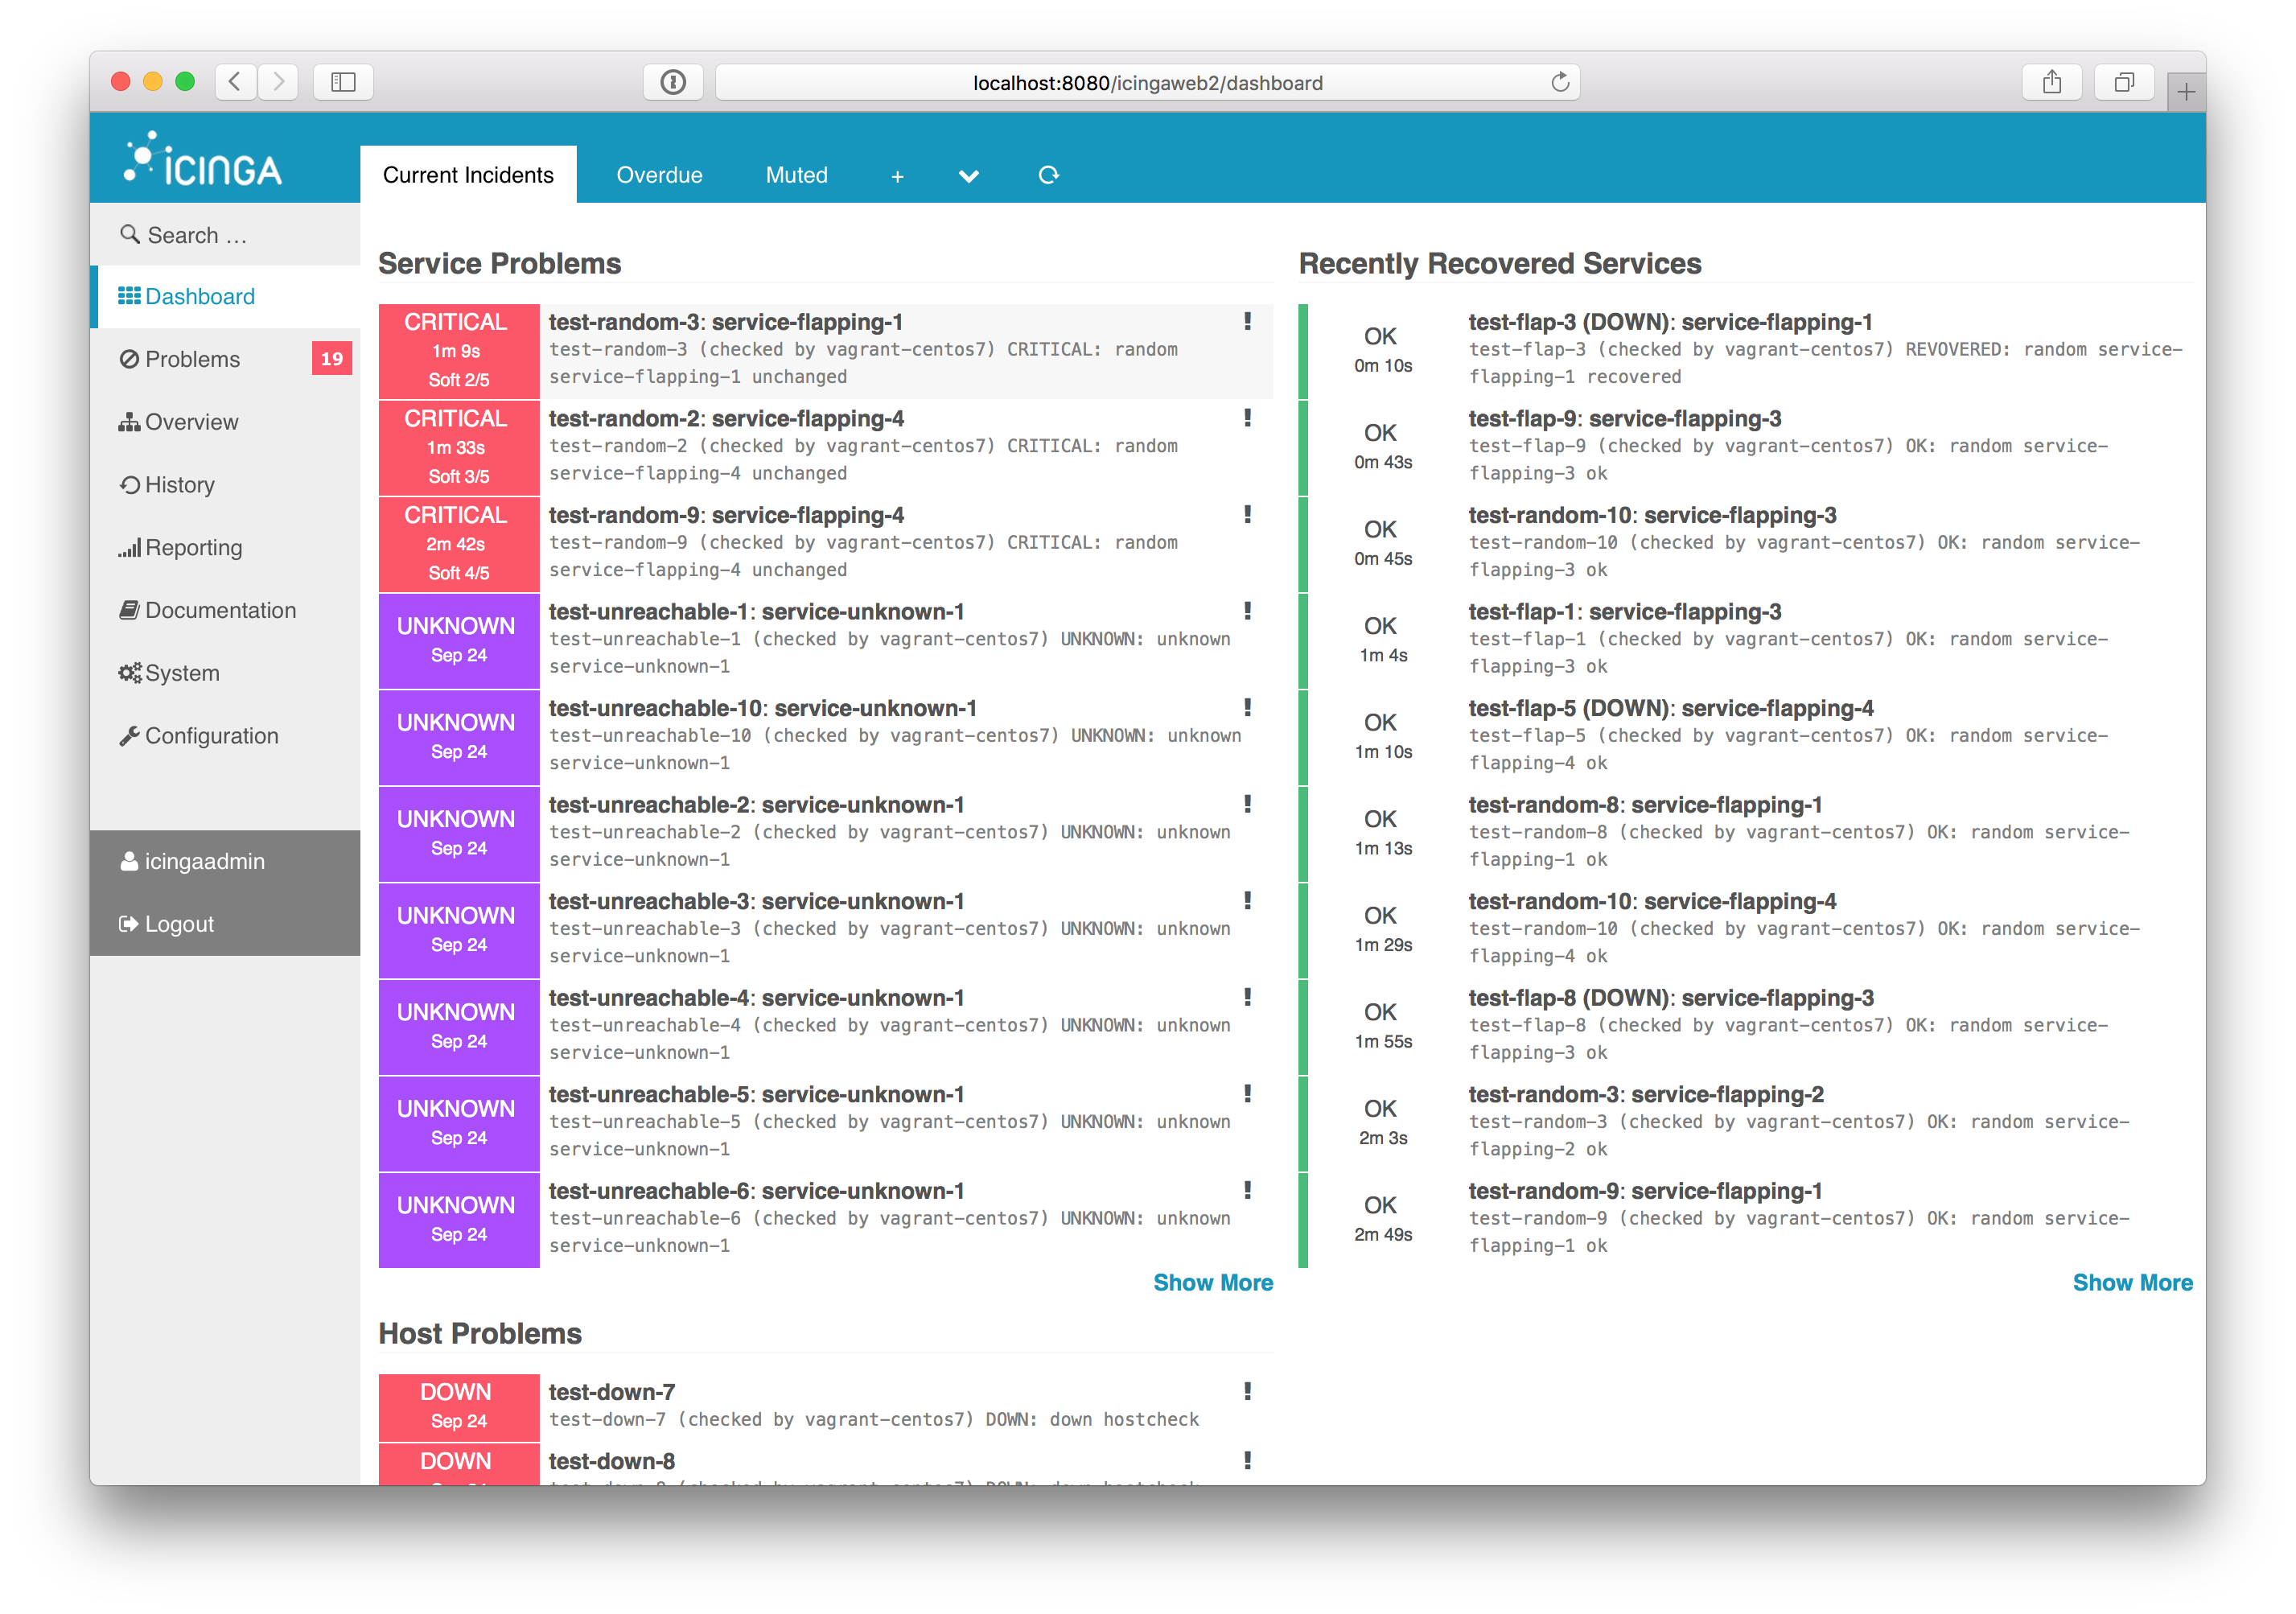
IcingaWeb2 seems like a decent UI with a lot of extension modules for a lot of purposes. It looks most extendable and flexible from what I’ve seen, yet has all the features you could expect from a monitoring system UI out of the box.
Drawbacks
The only drawback I’ve found so far is the complexity of the initial setup. It’s not that easy to understand the Icinga perspective on monitoring if you’re used to having something different like Zabbix.
Zabbix
Zabbix is a stable and reliable monitoring system with a steady development pace. It has a vast community, and most questions you might think of already have an answer somewhere, so you don’t have to worry if something is possible with Zabbix.
Scalability
Zabbix has a server that communicates with a single DB, and no matter what you do, with every other resource on hand (memory, network, CPU), you will hit DB disk IO limits. With 6000 IOPS on Amazon, we could maintain around 2k new values per second, which is a lot, but still leaves much to be desired. Proxies and partitioning could improve the situation with performance, but in terms of reliability, you always have the main DB, which is a single point of failure for everything.
Configuration systems integration
Zabbix is poorly prepared for a diversified environment, managed by a configuration management system. It has some low-level discovery capabilities for hosts and services, but they have their limits and are not tied to a configuration system. The only option for those who seek such integration is to make something themselves using API.
Audit log
Zabbix logs everything well, except one huge blind spot: Changes via API are not logged mostly, which could be or could not be the problem for your case. I want to mention that all issues Zabbix has been logged somewhere in its bug tracker, and if they have enough attention, they are getting fixed sooner or later.
UI
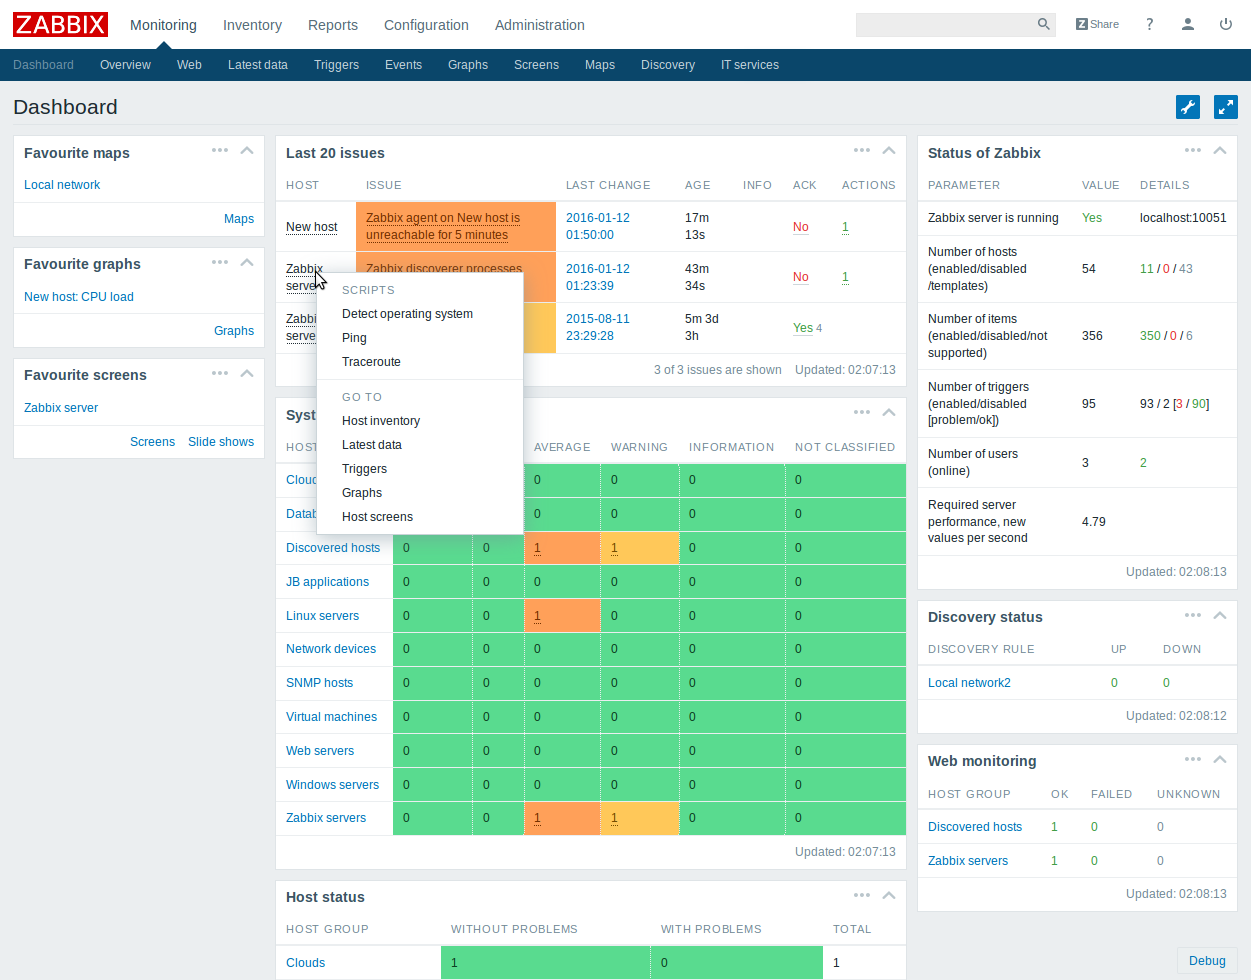
Zabbix has UI with all possible features built-in. The only bad thing you could say about it is that it’s not extendable at all — you have either to stick with what UI gives you or to do something on your own. You have no option to improve UI because of its general complexity.
Drawbacks
- Very basic analytic on what is going on, not right now, but in general (only tool here is “top 100 fired triggers”, which improved significantly in 3.0);
- The maintenance setting, as opposed to the Nagios-based system, couldn’t be set on trigger level, only on the host, and the whole system is very complex before the 3.2 release redesign;
- Alerts generation out-of-the-box leaves much to be desired. In my case, we had to implement external alerts aggregation system (to be released in opensource someday);
- Investigating Zabbix performance issues without experience turns into a mess because you have one big server that you should diagnose.
